
Monday, January 31, 2011
ag commodity watch 02-01
Given the inflation in food prices worldwide I felt it was time to look at a commodity fund. It seems during the past couple of weeks the sectors that are showing strength is the commodities. They have had a run and it appears they need a pullback before buying. Here is a chart:
 Please do your own research before acting. GL traders.
Sunday, January 30, 2011
Is NTFX a short candidate 1-31
It appears not quite yet. By mid-February it should make a top. Out of the money puts may be a better way to play the top (if it occurs as expected). One to watch for a bear move. Here is the chart:

Gl traders. Do your own analysis.

Gl traders. Do your own analysis.
The month ahead (Feb) comments and projection
What will February bring? I think my January projections were near the mark in anticipating highs around Jan 19 as the 1 year cycle was projected to top around that time frame and the 20 week cycle topping a week or so later (waiting confirmation the 20 week actually topped on Thu Jan 27).
So we start February (if I am right) with the 1 year cycle down and the 20 week cycle down. The longer 2 year cycle should be up, and the 40-41 month cycle down. So this should provide a somewhat negative bias from these longer cycles. Still I expect the medium term (the month of February) to be heavily influenced by the medium term cycles (20 weeks or shorter). So I have focused on those cycles.
As I indicated the 20 week cycle is down. There is a less influential 10 week cycle that is down though mid-February. Finally there is a 45 day cycle that should be down. So it looks like the first 2 weeks of February should have some fair sized declines and less so in the second half of February as the 10 week cycle turns up. See my prior post on next week's projections for the shorter cycles.
It appears the S&P GAP from the first of Dec could provide a target for the month and the bottoms a few points lower support. Here is a chart showing this information:
 Gl traders. Have a prosperous February.
So we start February (if I am right) with the 1 year cycle down and the 20 week cycle down. The longer 2 year cycle should be up, and the 40-41 month cycle down. So this should provide a somewhat negative bias from these longer cycles. Still I expect the medium term (the month of February) to be heavily influenced by the medium term cycles (20 weeks or shorter). So I have focused on those cycles.
As I indicated the 20 week cycle is down. There is a less influential 10 week cycle that is down though mid-February. Finally there is a 45 day cycle that should be down. So it looks like the first 2 weeks of February should have some fair sized declines and less so in the second half of February as the 10 week cycle turns up. See my prior post on next week's projections for the shorter cycles.
It appears the S&P GAP from the first of Dec could provide a target for the month and the bottoms a few points lower support. Here is a chart showing this information:

Saturday, January 29, 2011
The week ahead 01-31
Well - we got new highs this past week. Looks like the 20 week cycle had a bit more upward pressure than I anticipated. I had thought there was a good chance we had already seen the highs for the time being, but did allow as we might see new highs. I told you last week "expect the market bias to be down next week and possibly accelerate to the downside. Use bounces to buy bear ETFs (short, buy puts) and use drops to take profits. Longer holding of short (or short type) positions should be protected with stop orders." Not bad advice all things considered. I picked up some trading shares in QID Wednesday around $10.70. Missed the bottom on QID, but still ended up with a decent gain for the week (didn't look too good for a while). Also, I had highlighted the OIL etf and said it was getting into a buy area. Bought OIL on Wednesday and by the close Wednesday had a decent gain. Wanted to let it run (if it would) so I set a stop above my purchase price which got taken out On Thursday morning. Bought back into OIL later Thursday at a lower price (situation in Egypt made it look like a good bet). By Friday I had almost a 5% gain and I closed out the trade. So overall a good week and it appears the 20 week cycle may have topped Thursday and by Friday the bias was definitely down (and accelerated down).
So we should now have the 1 year and 20 week cycles down. Does this means the market falls off a cliff? Hang on Jethro - not so fast. We have some shorter cycles up next couple of weeks that will prevent any such move near term IMO. Still I think there is a much better than 50% chance the week will be down. Here is a chart:

So how about Monday. We have two cycles that have not yet bottomed but should do so during the day. So we should start the day by selling down some and bottom around 1:30-2:00 and recover some in the last 2-2.5 hours of the session. By day's end it could be a flattish day (depends on the longer cycles). Here is a chart:
 BTW - I expect/hope to sell my QID trading shares Monday morning for a nice gain.
GL traders - be sure to do your own analysis. I try to provide you a road map not a GPS system.
So we should now have the 1 year and 20 week cycles down. Does this means the market falls off a cliff? Hang on Jethro - not so fast. We have some shorter cycles up next couple of weeks that will prevent any such move near term IMO. Still I think there is a much better than 50% chance the week will be down. Here is a chart:

So how about Monday. We have two cycles that have not yet bottomed but should do so during the day. So we should start the day by selling down some and bottom around 1:30-2:00 and recover some in the last 2-2.5 hours of the session. By day's end it could be a flattish day (depends on the longer cycles). Here is a chart:

GL traders - be sure to do your own analysis. I try to provide you a road map not a GPS system.
Gold watch 01-29
What is going on with gold? Took a look at PHYS and did some projections. First I started with the Money Flow Index daily. I drew a line at the Jul 21 low on the MFI. Then I selected the peak at Oct 13. Then I drew a third line equal the distance Jul 21-Oct 13 as a pivot projection. As you can see that fell at Jan 7 ( a short term low). This illustrates the ability of MFI to project into the future.
 I then did a weekly MFI chart for PHYS. I selected the MFI low at week ending Sep 17 to draw a line. Then I drew a line at MFI top week ending Dec 30. Then I projected an equidistant the Sep 17-Dec 30 span from Dec 30 into the future to week ending Apr 1. This is a projected pivot point for PHYS.
 Finally I looked at the cycles (and projected the dominant cycles into the future). As you will see this projects cycle bottoms into the Apr 1-Apr 8 time frame. So the expected pivot in early April should be a bottom.
 Time will tell if these projections work out, but two different approaches project the same time frame for a pivot (bottom). Thought you would want to add this information to your data points when considering investments in gold.
GL traders. Be sure to do your own analysis.


GL traders. Be sure to do your own analysis.
Thursday, January 27, 2011
Comments and 1-28 outlook
The day started as expected and looked similar to expectations for the first couple of hours - then spent the rest of the day going sideways where as we had expected some down action. Clearly the shortest cycle(s) were having little impact. So we got an up day (when I was looking for a possibility of a down day). Not a great projection.
Tonight I have dropped the shortest cycle and added the next longest cycle. It looks like a down day. Starts off with a slight down move the first 2-3 hours and then the down turn accelerates into the close. Here is the chart:
 Caution: these projections may/may not be accurate. Short term movements can be difficult to predict. Do you own analysis, watch the market and trade what you see.
GL traders
Tonight I have dropped the shortest cycle and added the next longest cycle. It looks like a down day. Starts off with a slight down move the first 2-3 hours and then the down turn accelerates into the close. Here is the chart:

GL traders
Combining indicators continued
I am an X computer geek and I like rules. You cannot write a computer program without rules. Some stock systems allow you to implement trading rules.... If you have access to such a system then maybe you can use a rules based system real time.
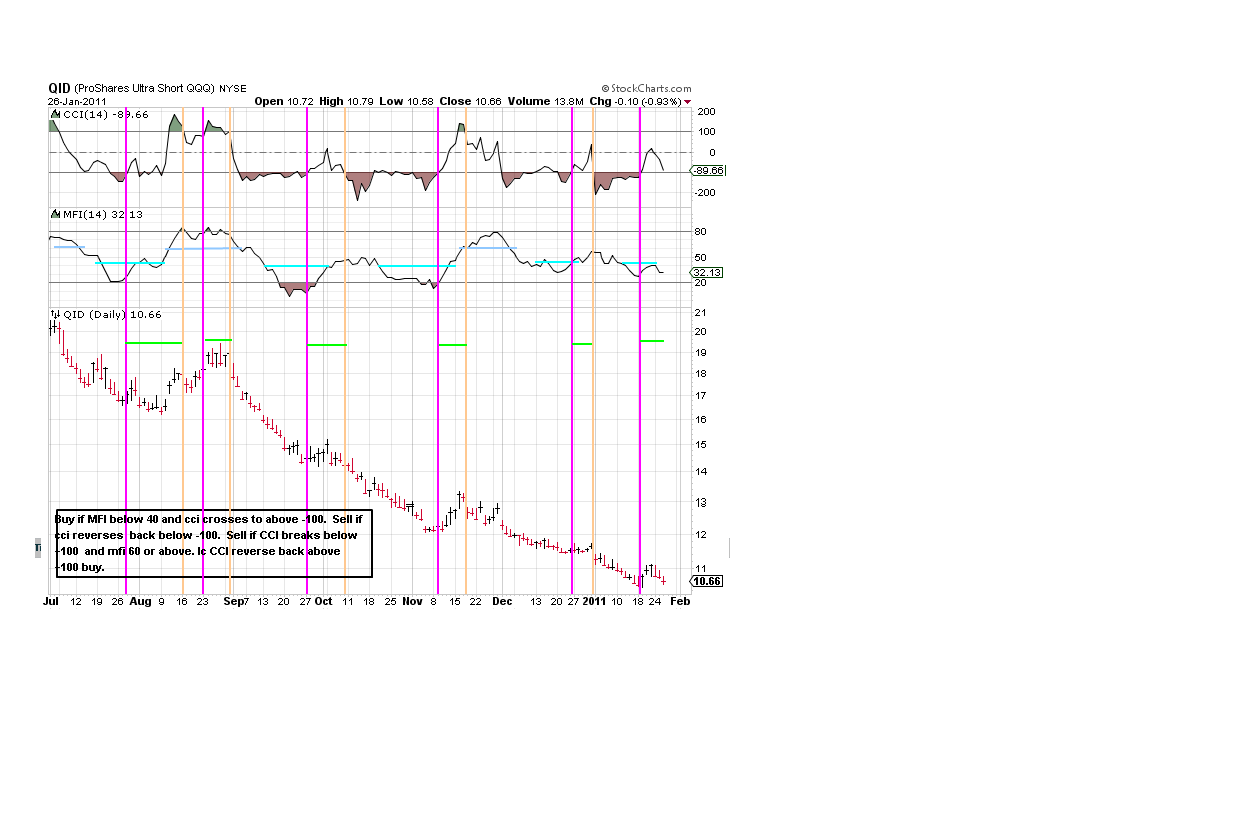
I promised to show you the stock I used in last night's discussion of CCI/MFI combination. Here it is:
 If you examine the chart I think you will see this system would have captured a lot of the upsides (green horizontal lines) and avoided most of the dips (red horizontal lines). I tried to test this on several stocks or ETFs. How would it have worked on a bear ETF the past few months. See for yourself:
 Any help you can offer in testing this is much appreciated. Also, if you have "rules" based systems you feel work please share.
GL traders.
I promised to show you the stock I used in last night's discussion of CCI/MFI combination. Here it is:

GL traders.
Wednesday, January 26, 2011
Combining indicators for buy/sell signals
Many people look at multiple indicators to try and determine entry/exit points for trading stocks. I often see references to RSI/MACD and divergences, etc. But I have never seen a set of rules as what exactly is a buy signal or a sell signal using these multiple indicators. It seems to be more intuitive than rule based.
Now it seems to me if we are going to use these indicators we ought to have a set of rules as to what is a "buy" signal and what is a "sell" signal. As you may have noticed I use CCI on most of my charts and indicate when it is issuing a buy signal or sell signal. I recently introduced the MFI as another indicator that may be useful in determining a "buy" or "sell" signal.
So what if we combine the two and lay out a set of rules for their use? I have tried to do this. Understand I have not tested this over long time frames (a variety of market conditions) nor a large number of stocks. So it may need some refining over time. It seems to work on a variety of stocks though.
You can help me road test this? Here is how it works:

Try this out on some of your favorite stocks and let me know if you see problems with it. Your help, comments and feedback will be greatly appreciated. Oh, you want to know what the stock is an see how well it worked? It is a stock I have posted about previously here on this blog. But if you really want to know what the stock is check back tomorrow night or Friday morning and it will be posted. :)
GL traders. Enjoy the home brew.
comments and outlook 1-27
Well I said we would open up and likely set new highs before noon. And we did. I expected some sell off in the afternoon (which was more sideways than down). We did finish down a bit from the days highs though I thought we would be 2-3 points lower at the close. Finally we closed green as I projected.
But, what about tomorrow. Well we should have the 11 day cycle topping so it may offer some downside pressure. At the very least no upside pressure. Here is the chart:
 The short cycles play out this way I believe. A slight blip up the first half hour or so until the 5.5 hour cycle tops. Maybe we take out 1300, but the slight pullback into the close makes it a little harder. Then it appears we should head down until around 1:30. Some slight recovery into the close, but down for the day.
Here is the chart:
 Again - these projections are not meant to drive your trading but to give you a general idea of what I expect based on the short cycles. Do your own analysis and decide based on actual market action.
GL traders.
But, what about tomorrow. Well we should have the 11 day cycle topping so it may offer some downside pressure. At the very least no upside pressure. Here is the chart:

Here is the chart:

GL traders.
Tuesday, January 25, 2011
Bussiere's 2011 outlook
Stocks
The SPX should test the July 2010 lows near 1000 by the first half of 2011, but we will need a Spanish or other crisis to reach 900 or less and keep us below 1000-1100 by year end.
Bonds
The 30 year Bond should hold above 115 in the first quarter and probably rally to 130 by the fourth quarter.
Currencies
The US Dollar should hold above 0.75 in the first quarter and probably rally to 0.90 by the fourth quarter.
Commodities
Gold and Silver are pulling back but are likely to challenge the highs again near May before declining into the fourth quarter and turning parabolic into 2012-13.
The Very Bullish Consensus needs a lot of Jobs in 2011 and that is not very likely to happen
The Very Bearish View needs a Credit Crisis in 2011 which is likely to happen in Spain
The Muddle Through Alternative takes us to 1450 by year end but is unlikely to happen with the Euro debt
issues
The Cycle Progression for the US Dollar suggests strength and that is generally negative for Equities
The Cycle Progression for Bonds suggests strength into September and that is generally negative for Equities
The SPX Crash of 2008 makes Cycle Progression difficult but lows in July and maybe October are probable
The Cycle Progression for Silver and Gold suggest a choppy high into May
http://www.safehaven.com/article/19755/astrocycle-analysis-for-2011
GL traders - enjoy
comments and outlook for 01-26
My comments and outlook for 01-25 were close. Timing may have been off in spots - but in general it was a sideways day closing at day's highs.
Based on the 3 short cycles all being up to start the day - tomorrow looks like we open higher and probably set new 52 week highs on the S&P 500 by or before noon. Possibly we give a good part of the morning gain back in the afternoon but probably end up for the day. Will the State of Union have an effect? I don't have a clue - I am telling you what the charts/cycles are saying as I interpret them.
Here is my projections:
 Do your own analysis before trading - this represents my opinion which may be wrong. A longer cycle turning down could override the short cycles...
Gl traders.
Based on the 3 short cycles all being up to start the day - tomorrow looks like we open higher and probably set new 52 week highs on the S&P 500 by or before noon. Possibly we give a good part of the morning gain back in the afternoon but probably end up for the day. Will the State of Union have an effect? I don't have a clue - I am telling you what the charts/cycles are saying as I interpret them.
Here is my projections:

Gl traders.
Monday, January 24, 2011
comments and today's expected action
Monday closed higher with DOW challenging the 12k area. AH earnings were mixed. So far 75% of S&P earnings have beaten analyst's estimates. This week over 1/5 of the S&P 500 reports. Potential for a lot of volatility.
Tuesday looks less like a "push up" day and more like a sideways type day based on the very short cycles. Of course the longer cycles could push the market higher or lower. I believe the 20 week cycle is pushing toward a top providing some support for the market and the 1 year cycle has not built enough downward momentum to overcome that.
Here is my projection for today:
 Caution: Do not use these projection to make investment decisions as they may prove totally wrong. As always do your own analysis and use stops to limit losses and protect gains.
GL traders.
Tuesday looks less like a "push up" day and more like a sideways type day based on the very short cycles. Of course the longer cycles could push the market higher or lower. I believe the 20 week cycle is pushing toward a top providing some support for the market and the 1 year cycle has not built enough downward momentum to overcome that.
Here is my projection for today:

GL traders.
Sunday, January 23, 2011
OIL etf update 1-23
A new look at the technicals for OIL suggest that it may be hitting an area in which you may want to buy.
Here is the chart:
 GL traders, do your own analysis before acting.
Here is the chart:

kitchin and wall cycle continued...
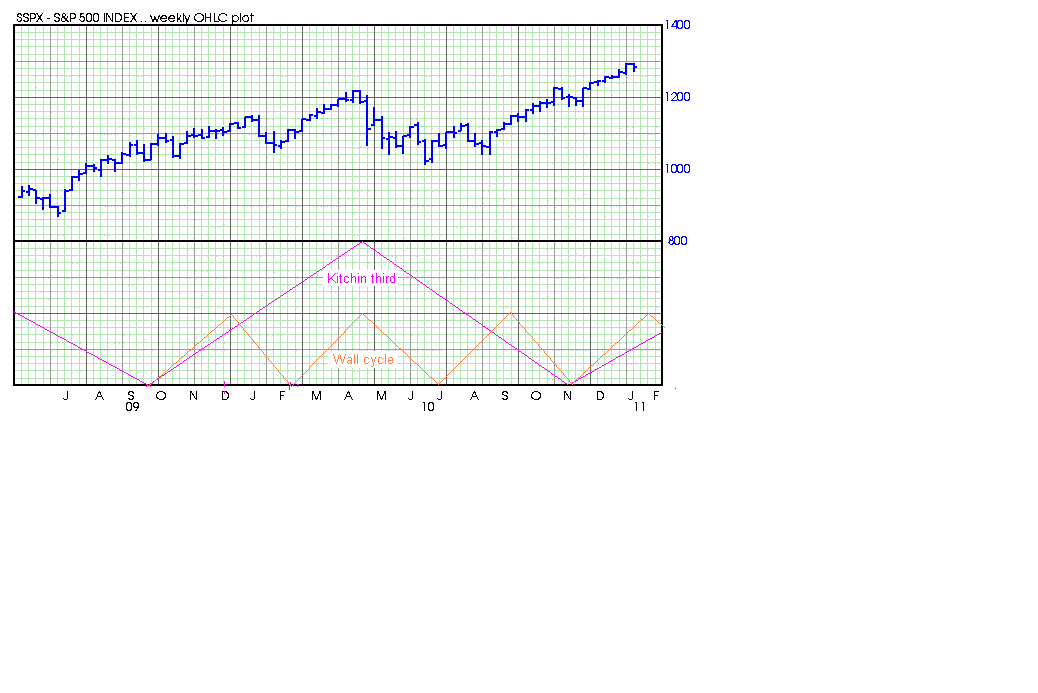
The Kitchin cycle at 42 months is approximately 1/3 of a 10 year cycle (3 x 42 = 126 months or 10.5 years). If we use the Dewey cycle length instead (40.68 months) it is even closer (3 x 40.68 = 122.04 months). So maybe the 10 year cycle is really 10.17 years? Lets look at this graphically:
 Now this is interesting. A Kitchin cycle starts about the same point as the 10 year cycle does in 2002 and ends about the same point as the 10 year cycle does in 2012. So it appears the Kitchin cycle is 1/3 of a 10 year cycle? Drilling down the a Kitchin third is 1/3 of a Kitchin cycle:

Drilling down further the Wall cycle (20 weeks) is 1/3 of a Kitchin Third (or 1/9 a Kitchin cycle). See for yourself:
 As a result you have the 10 year, the Kitchin, the Kitchin Third, and The Wall cycle bottoming together in 2012 (just as they did in 2002). And this my friends does not look good for the year 2012.
Continuing this - what is 1/3 of 20 weeks. 20 weeks is 100 trading days so 1/3 is 33.33 days or what I commonly call the 33-34TD cycle. Here is how it looks graphically:
 Now 1/3 of 33 is 11. So is there an 11TD cycle? Lots look at a chart:

Cliff Drokes (cycle authority) claims the 30 year cycle is one of the more important cycles (3 x 10 year). So lets summarize what we have learned. From the Kitchin cycle using multiples of 3 or factors of 3 we have the 30 year cycle, the 10 year cycle, the 3.33 year cycle (approximately), the 14 month cycle, the 20 week cycle, the 34Td cycle and finally the 11TD cycle. In all my reading of cycles I have never seen all these different cycles related to the Kitchin cycle this way.
Gl traders. Your thoughts appreciated (pro and con).


Drilling down further the Wall cycle (20 weeks) is 1/3 of a Kitchin Third (or 1/9 a Kitchin cycle). See for yourself:
Continuing this - what is 1/3 of 20 weeks. 20 weeks is 100 trading days so 1/3 is 33.33 days or what I commonly call the 33-34TD cycle. Here is how it looks graphically:


Cliff Drokes (cycle authority) claims the 30 year cycle is one of the more important cycles (3 x 10 year). So lets summarize what we have learned. From the Kitchin cycle using multiples of 3 or factors of 3 we have the 30 year cycle, the 10 year cycle, the 3.33 year cycle (approximately), the 14 month cycle, the 20 week cycle, the 34Td cycle and finally the 11TD cycle. In all my reading of cycles I have never seen all these different cycles related to the Kitchin cycle this way.
Gl traders. Your thoughts appreciated (pro and con).
Saturday, January 22, 2011
01-22 the outlook for the week
We have mentioned several times over the past few weeks that ideally the 1 year cycle would turn Jan 19. It appears that the S&P and Nasdaq topped Jan 18 and turned down Jan 19 and the trend is now down. Sell signals were triggered (see following chart). I suppose the market could reverse next week and prove this to be a minor dip... If you tightened stops as suggested you probably took profits on at least some long positions this past week.
It appears a 20 week cycle will top next week. If this proves out it will add additional down pressure to the market. So I would estimate a reversal up probability is under 20%.
Given my outlook I have adopted a trading strategy of trading the bear ETFs (QID in particular). So I buy QID when the market pops (QID is down) and sells when the market is down (QID is up). I have a core position in QID I am holding longer term. For example - let's say I hold a core position of 700 shares and trade in/out 300 shares. Friday before the close I sold 300 shares for $11.06 that I had bought earlier Friday for $10.79. That was my second sell for the week (having bought some QID for trading the prior week).
If you are unable to monitor the market closely and want to trade a bear ETF position - I would suggest you use limit orders to buy and sell or work with a broker that can monitor for you.
I expect the market bias to be down next week and possibly accelerate to the downside. Use bounces to buy bear ETFs (short, buy puts) and use drops to take profits. Longer holding of short (or short type) positions should be protected with stop orders.
Here is the SPX:

GL traders. You shouldn't care which way the market moves - as long as it moves.
Thursday, January 20, 2011
Kitchin and Wall cycles
You have been introduced previously to the 3.39 year (Dewey cycle) or 40.68 months. Others talk about a 41 month or 42 month cycles. I believe all these people are talking about the same cycle (and will assume as much) . The 42 month cycle is commonly called the Kitchen Cycle.
The Kitchin Third, as its name implies, is one third the length of the Kitchin Cycle. Since the ideal Kitchin cycle is 42 months or 1277.5 days in length, the ideal Kitchin Third is 14 months or 425.83 days (about 60 weeks).
PQ Wall (noted cycle authority) said Since a Kitchin cycle is made up of nine Wall Cycles, each Kitchin Third is made up of three Wall Cycles (or 20 weeks per Wall cycle). The Kitchin Cycle often unfolds in the three sections, but Kitchin Thirds are not typically as clear as other cycles.
Market forecasting master PQ Wall had a general rule of third last and weakest. This goes for the final Kitchin Third in a Kitchin Cycle, but also goes for Wall Cycle #3, #6, and #9, i.e, the final Wall Cycle in each Kithchin Third.
Got all that? Maybe a couple of pictures (charts) will help make it clearer:
 Now let's look at a Kitchin Third:
 Disclaimer: placement of cycles may need to be shifted slightly. The charts are for illustrative purposes only. Now you know why I keep talking about a 20 week cycle.
GL traders.
The Kitchin Third, as its name implies, is one third the length of the Kitchin Cycle. Since the ideal Kitchin cycle is 42 months or 1277.5 days in length, the ideal Kitchin Third is 14 months or 425.83 days (about 60 weeks).
PQ Wall (noted cycle authority) said Since a Kitchin cycle is made up of nine Wall Cycles, each Kitchin Third is made up of three Wall Cycles (or 20 weeks per Wall cycle). The Kitchin Cycle often unfolds in the three sections, but Kitchin Thirds are not typically as clear as other cycles.
Market forecasting master PQ Wall had a general rule of third last and weakest. This goes for the final Kitchin Third in a Kitchin Cycle, but also goes for Wall Cycle #3, #6, and #9, i.e, the final Wall Cycle in each Kithchin Third.
Got all that? Maybe a couple of pictures (charts) will help make it clearer:


GL traders.
Comments and outlook for 01-21
As expected the downward bias continued for a second day. A little more of a bounce than expected in the afternoon. Tomorrow the downward bias should continue. We are looking for the 20 week cycle to top soon and this may limit the downside, but when it tops it will add to the downside bias.
Here is a chart showing expectations:
 GL traders. I trimmed my bear ETF holdings today selling 30% of my QID holdings (as I advised). On a bounce I expect to buy these shares again.
Do your own analysis please.
Here is a chart showing expectations:

Do your own analysis please.
Wednesday, January 19, 2011
The latest from Charles Nenner cycles guru
"Nenner sees multiple peaks developing in a number of equity indexes coming at the end of January. He is still long the S&P 500, which could run as high as 1,480 in a best case scenario. He will sell his position if the SPX trades below 1248, or by January 25, whatever happens first. "
"The wily Dutchman sees an 18 month bear market in bonds that we all should be trading around. Ten year yields will balloon up from the current 3.40% to 4.20% and the 30 year may see as high as 5.30%."
"What would Nenner do with new money he received today? What are the cleanest trades out there? It’s very simple. He would sell the next two point rally in bonds through buying the (TBT). "
http://www.zerohedge.com/article/charles-nenner-technical-analyst-stars-gives-2011-forecast
Live interview:
http://www.madhedgefundtrader.com/january-10-2011-charles-nenner.html
comments and outlook for 01-20
If you have followed my posts you know I have mentioned Jan 19 several times as a projected top for the 1 year cycle. Did we get a top? Too early to say for sure - but it had that feel. DOW held up fairly well (primarily due to IBM). If this is indeed a top I would expect some addition sell down tomorrow. The short cycles may offer a little support, but if we truly topped they will be over run.
In the weekend post I mentioned nearly everyone was convinced we would break 1300 (and we still could), but for now my 1298 high call is looking better....
Here is the short cycles. They may temper the sell down, but don't try and trade them:
 GL traders. If you tightened stops as suggested you probably raised some cash today in some positions. If you have short (bear) ETFs and we get a down day tomorrow you may want to trim positions before the close and add back on pops. Use your own judgment - just a thought.
In the weekend post I mentioned nearly everyone was convinced we would break 1300 (and we still could), but for now my 1298 high call is looking better....
Here is the short cycles. They may temper the sell down, but don't try and trade them:

Tuesday, January 18, 2011
Patterns and cycles - the "W" pattern
2-3 weeks ago I introduced the idea that patterns can be explained with cycles. I also pointed out we could (hopefully) identify the cycles involved and where they fall on the time line. I showed you the analysis of an inverted head an shoulders at that time.
Tonite I am going to show you a "W" pattern with annotations showing where the cycle pivots occur. Here is the pattern:
 I have two goals: 1) inform and 2) teach. GL traders.
Tonite I am going to show you a "W" pattern with annotations showing where the cycle pivots occur. Here is the pattern:

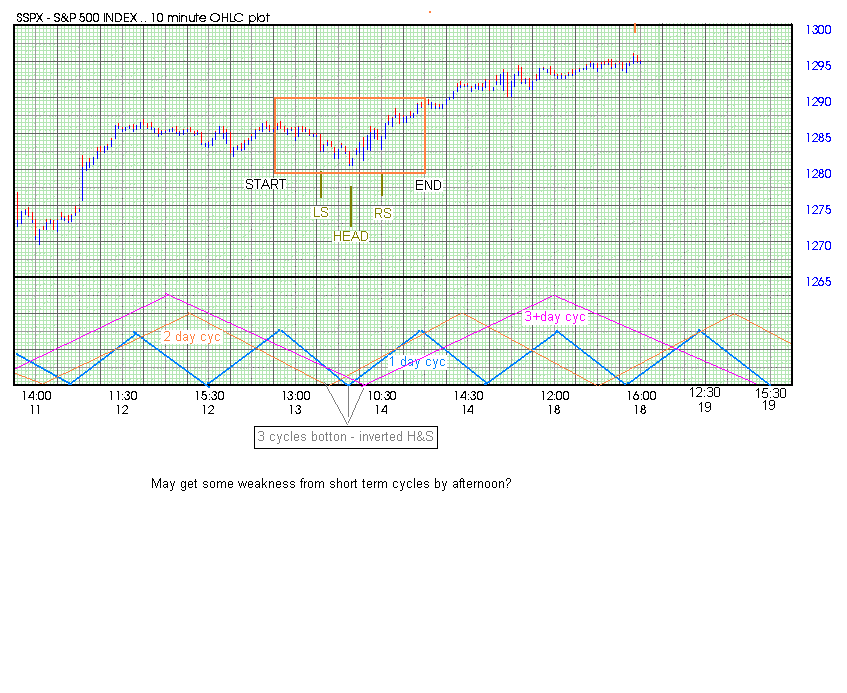
01-18 comments and outlook
The longer cycles (1 yr and 20 week) keeps pushing the market higher, but for the S&P it is painfully slow going. It has the feel of a market that is tired. APPL and IBM had very good earnings. Rationally one would think this will take the market higher (and it may), but markets normally hit tops during periods of good news and it seems the news can't get much better on the earnings front. Just suggesting that maybe this excellent news could mark the apex in the news and the market. Of course with the FED providing POMO tomorrow maybe they keep the markets higher marginally.
Looking at the short cycles one might suspect some weakness by the last couple of hours tomorrow:
 Gl traders
Looking at the short cycles one might suspect some weakness by the last couple of hours tomorrow:
Monday, January 17, 2011
01-15-11 The week ahead
We set new highs in the week just past. Which is not surprising - we anticipated that may happen. On Tue/Wed we may again set new highs as we closed within a couple of points of highs for the week on Friday. We may even break 1300 as everyone seems to expect. I hate it when everyone seems to expect the same thing - so I will be conservative and say we go above 1295 and fail to surpass 1300 just to be a contrarian. I hope you have tightened up you stop orders as I have been recommending the past couple of weeks.
I was not certain of my placement of the 20 week cycle, so I did some research and believe I did have that cycle incorrectly placed. Looking back 2-3 years it appears that the 20 week cycle ( verified from other sources as well) should be like this:
 I have also charted longer cycles (up to 41 months) to give you a sense of the longer term environment. The 41 month cycle is down, the 2 year cycle is down, the 1 year cycle is ready to turn down and so is the 20 week cycle. I believe this sets up a negative cyclic environment for the market for the final week of January and all of February. This down trend may well extend to late March.... Here is the chart:
 Finally, looking at the shorter cycles - the 22td (trading days) cycle topped and is turning down. The 34td cycle is up. These 2 cycles offset next week, so we are looking to see what the 1 year and 20 week cycles do. Here is the chart:
 Next week could be very interesting if as expected we get the 1 year and 20 week cycles turning. Most likely scenario is up 1-2 days to start the week and then selling in the latter part of the week.
GL traders. Keep those stops tight and watch for fireworks next week. One or two pieces of bad news could create the biggest sell down we have seen for a while given the cyclic environment.
Update 1/17 - 1:29 pm EST
Is the Jobs news the catalyst to cause the market to turn? AAPL is about 20% of the NAZ 100.
Spanish bond auction canceled..... They will revert to distribution thru banks.
I was not certain of my placement of the 20 week cycle, so I did some research and believe I did have that cycle incorrectly placed. Looking back 2-3 years it appears that the 20 week cycle ( verified from other sources as well) should be like this:


GL traders. Keep those stops tight and watch for fireworks next week. One or two pieces of bad news could create the biggest sell down we have seen for a while given the cyclic environment.
Update 1/17 - 1:29 pm EST
Is the Jobs news the catalyst to cause the market to turn? AAPL is about 20% of the NAZ 100.
Spanish bond auction canceled..... They will revert to distribution thru banks.
When do I sell?
Have you ever watched a sizable gain melt away as you struggled over the decision - should I sell? It is better to take the emotion out of that decision. I have shown you how channels, CCI and cycle tops can indicate a sell. Still you have to pull the trigger.
So maybe it would be better to have a way to set automatic sells using trailing stop orders. Problem with that is you have to make a judgment as to how tight to set stops. On an average beta (average volatility) stock that may be 5% or so below current price. On a stock the has a higher beta (more volatile) that may be 8-10% below the current price. You don't want to get taken out just as the stock is ready to start a run.
What if we set looser stops until a top is on the horizon? Then we tighten our stops so as to keep most of our profits. Is there a way to do that? To keep going up a stock needs to attract more buying. More buying implies more money flowing into the stock. But since stocks normally overshoot money flow into a stock may actually top and head down before a stock tops. And we want that up move generated by that overshoot in price.
So when we detect a pullback in the money flow into a stock we don't sell we tighten our trailing stops. Say if we had them at 5% we might tighten them to 2.5-3%, or if we had them set at 10% we may tighten them to 5%. This way we continue (hopefully) to ride the trend and the market will make the sell decision for us and never again will we ride a winner down.
I have charted and annotated the chart for you using SPY as my example with the MFI (Money Flow Indicator). Here is the chart:
 GL traders. It is not to late to make a New Year's Resolution to never again ride a winner down because emotionally you can not decide. Let the market decide for you.
So maybe it would be better to have a way to set automatic sells using trailing stop orders. Problem with that is you have to make a judgment as to how tight to set stops. On an average beta (average volatility) stock that may be 5% or so below current price. On a stock the has a higher beta (more volatile) that may be 8-10% below the current price. You don't want to get taken out just as the stock is ready to start a run.
What if we set looser stops until a top is on the horizon? Then we tighten our stops so as to keep most of our profits. Is there a way to do that? To keep going up a stock needs to attract more buying. More buying implies more money flowing into the stock. But since stocks normally overshoot money flow into a stock may actually top and head down before a stock tops. And we want that up move generated by that overshoot in price.
So when we detect a pullback in the money flow into a stock we don't sell we tighten our trailing stops. Say if we had them at 5% we might tighten them to 2.5-3%, or if we had them set at 10% we may tighten them to 5%. This way we continue (hopefully) to ride the trend and the market will make the sell decision for us and never again will we ride a winner down.
I have charted and annotated the chart for you using SPY as my example with the MFI (Money Flow Indicator). Here is the chart:

Thursday, January 13, 2011
01-13 comments and Fri outlook
As I indicated in yesterday's comments I expected a down bias for Thur and Fri. We got a minor pullback today and that should continue tomorrow (maybe with a little more push). Toward the end of day (and week) we have multiple of these short cycles making lows. So the day's lows could easily be near the end of the day.
See for yourself:
 GL traders. Do your own analysis.
See for yourself:

Wednesday, January 12, 2011
01-12 comments and Thur outlook
Why did we not get the expected pullback midday? Seems there was a longer cycle influencing market movement. So lets back off and look. There is a 5 +/- day cycle that was up and topped today that appears to have overridden the shorter cycles. Take a look:
 This cycle should have topped today and will be down the next 2.5-3 days. This increases the odds that Thur and Friday will have a down bias. Here is the outlook for tomorrow:

It appears that the low for tomorrow should be between 3:00 and 4:00. It also appears the day should start with a downward bias (maybe a gap down?).
Do you own analysis - this is my opinion based on the data I have looked at. GL.


It appears that the low for tomorrow should be between 3:00 and 4:00. It also appears the day should start with a downward bias (maybe a gap down?).
Do you own analysis - this is my opinion based on the data I have looked at. GL.
Tuesday, January 11, 2011
01-11 comments and Wed outlook
The low today was around 2 pm the bottom of the 5 hr cycle. Seems that cycle has more amplitude than realized as I expected the 1 day and 3 day cycle to cause a bottom at the close (as the 5 hr moved up) - which did not happen.
Should be up the first 45-60 minutes as 5 hr cycle tops. Then should get a bottom 12:30-1:00 pm as 5 hr and 3 day cycle bottoms. The day's top should be around 2:30 pm as 5 hr and 1 day cycles top. Looks like Wednesday afternoon presents a good shot at breaking to new highs on the S&P.
As always - this is my opinion and is intended only to assist you in your own analysis and not as a substitute for your analysis. Here is a chart of the S&P with projections:
 GL traders. FYI: http://www.safehaven.com/article/19618/yearly-cycle-low-approaching
Should be up the first 45-60 minutes as 5 hr cycle tops. Then should get a bottom 12:30-1:00 pm as 5 hr and 3 day cycle bottoms. The day's top should be around 2:30 pm as 5 hr and 1 day cycles top. Looks like Wednesday afternoon presents a good shot at breaking to new highs on the S&P.
As always - this is my opinion and is intended only to assist you in your own analysis and not as a substitute for your analysis. Here is a chart of the S&P with projections:

Monday, January 10, 2011
1-10 comments and Tue outlook
Today SVA flashed a CCI buy signal early and took off. If you were not paying close attention (and I wasn't) you missed it. The 50 day MA crossed the 200 day MA (from below to above) - and this is a bullish signal usually. Don't chase SVA. If it pulls back to $4.30-4.35 it may be good for a trade. Also, LSE CCI signal became stronger and it moved up. Again - don't chase, but if it pulls back to $5.70 or less it may make a decent trade.
Over the weekend I posted a short term chart showing that the S&P should top around 3:00 PM (it topped about 3:40). Here is a S&P chart with projections for tomorrow:
 At or near important reversals the short cycles often give us a good picture of what is likely to happen as longer cycles are turning (flat). If this proves out then tomorrow should be a down day.
GL traders
Over the weekend I posted a short term chart showing that the S&P should top around 3:00 PM (it topped about 3:40). Here is a S&P chart with projections for tomorrow:

GL traders
Saturday, January 8, 2011
01-08 the week ahead
The top of the 1 year cycle is getting close. The high last year was Jan 19, so in a perfect world Jan 19 would be the top this year. Of course, the world is not perfect. There is a cluster of dates derived from different sources (Bradley, Gann, Fib) falling on Jan 14-16 so the top may be Friday (Jan 14) or Monday (Jan 17). So be on alert for a top next week torward the end of the week.
It appears the 20 week cycle should bottom Monday and the 34td (trading day) cycle on Friday. The 22td day cycle should be up. So during the week we have the 20 week cycle up, the 22td cycle up and the 1 year cycle up. So this should give us an upward bias for the week. It would not surprise if the S&P set a new high above 1280. So sell the pop (if we get one) as it could be the top for a while. At the very least move your trailing stops up on any pop.
We got a weak CCI sell Friday, but I don't trust it at this point and would wait and rely on trailing stops. If we are truly approaching an intermediate top we should get confirmnation of the CCI sell soon. I expect a top around 1285 (say 75%) and the possibility of a low around 1255 (say 25% possibility).
Here is the S&P chart:

GL traders, be careful and if warranted take profits. It may be time to look at stocks that have chart patterns suitable for shorting (or buying puts) or time to consider a short ETF. I will try to feature some such stocks this coming week. As always do your own DD.
01/09 - 11:00 am update
http://www.safehaven.com/article/19583/global-stock-market-cycle-forecast-2011
The smaller stock market cycles, specifically the Quarter Wall and Wall #4, is overbought and topping out. A sizeable correction is in store, likely into late January to mid-February, which will produce the bottom of Wall cycle #4. Out of this low Wall #5 has a chance to rally to new highs, because it is the second Wall cycle in the unfolding set of three. The second Wall cycle in a set typically rallies to a new high. The high of Wall #5 is expected around the May target, whether it is a new price high or not. That will likely be the final high in this final business cycle of the long wave. A rally to a new high in Wall #6 will be a run against the clock of the ticking global long wave debt bomb. When it goes off, it will drive the global stock market cycles down
Update 2 - Monday:

GL
01-08 cycles and chart patterns
If we understand how cycles form different chart patterns it can add to our knowledge and help us in analyzing where a stock/index is within a cycle. I will use an Inverted Head and Shoulder pattern to illustrate. First - patterns are formed by the intersection and alignment of different cycles. Here is how a Head and Shoulder (and Inverted Head and Shoulder) is formed:
 That is not so complex is it? Let's use this knowledge to deconstruct a real live Inverted Head and Shoulders pattern (S&P) from this past week to figure out what cycles are interacting and the length of those cycles. If we can do that it could provide us valuable clues about the future action of the S&P:

With this knowledge we can project future tops/bottoms of the cycles we identified. Hope you find this helpful in your analysis for short term trading.
GL traders.


With this knowledge we can project future tops/bottoms of the cycles we identified. Hope you find this helpful in your analysis for short term trading.
GL traders.
Friday, January 7, 2011
01-07 LSE and ANAD update
Today CCI gave a buy signal on LSE. But, it seems to be a weak signal. So hold off taking action until you get a cycle bottom or envelope channel confirmation. Target buy area $5.55-5.60. Here is the chart:
 ANAD looks good to hold as 3 cycles are up next week. The 22td cycle may top by end of the week, so that should be first point to consider selling. But, 2 other cycles will remain up. Hold with trailing stop loss orders while waiting for signals or until 34td cycle tops the following week..
Here is the chart:
 Do your own DD. Good luck traders.

Here is the chart:

01-07 how did we do for the week
On 01-01 we highlighted 2 stocks (ANAD, DCTH). We said ANAD buy signals looked good. ANAD had a very good week (made a few shekels on it). We said though DCTH was giving buy signals other factors (cycle alignments) did not look favorable and probably should take a pass. DCTH had a bump mid week, but overall it was not a good week for DCTH. ANAD is now at a point where it could have a "sell" signal soon - so be careful if you bought.
http://swingcycles.blogspot.com/2011/01/01-01-dont-blindly-act-on-signals.html
For the week I said "Overall though I think the weight of the cycles should give us some downside by the end of the week.", Check.
I featured LIZ as a potential near term buy. Their 2H guidance last evening was ugly and it was down 13% today. No buy signals yet, but this probably set a bottom today and we expect buy signals soon. Others featured were SVA - somewhat negative comments Thursday morning in the news. But, it held up well. Expecting a buy signal soon. Then there was LSE which appears to have triggered a CCI buy signal today (more on this one later after I take a closer look). Then there was VASC and SHO last evening. Nothing new to report on these - still waiting for signals.
Overall, looks like we got the market direction right (higher high than we thought by mid week) with weakness the last 2 days of the week. And a couple of good calls on stocks (ANAD and DCTH). As to the rest time will tell.
Have a good week end.
Thursday, January 6, 2011
01-07 extent of the expected Jan/Feb pullback
If we get the "expected" pullback then how much? There is a pretty good record over the past 11 years of pullbacks after early year highs. So what does history tell us? Almost half (5) were at least double digit % declines. Almost half (5) were 5-10% declines. Only 1 was less than a 5% decline.
Here is the beginning of the year declines:
 If history holds we will have over a 5% decline and about 50-50 chance of a double digit % decline.
Here is the beginning of the year declines:

01-05 LIZ analysis
LIZ looks like it could be a buy around $6.75 - if it gets there over the next couple of days. Here is a chart:
 Do your own analysis. GL traders.
01/06 update AH. Why should we wait for signals and not anticipate them. AH LIZ updated their 2H outlook, and it wasn't pretty. But, it will probably create a buy opportunity in the next 2-3 days. Wait.

01/06 update AH. Why should we wait for signals and not anticipate them. AH LIZ updated their 2H outlook, and it wasn't pretty. But, it will probably create a buy opportunity in the next 2-3 days. Wait.
1-6 two more to watch
The stocks I am highlighting are down and a bottom is anticipated soon. Often there is a reason. The news may not be out yet (see LIZ and SVA updates about news today after they were presented). So always do your DD and do not anticipate a "buy" signal and move too soon!!!
Here are two more to watch for potential entry over the next 2-4 trading days:

 Use caution - be patient these are low priced stocks and a small move can be a large percentage. GL traders.
Here are two more to watch for potential entry over the next 2-4 trading days:


Wednesday, January 5, 2011
watch these two for potential buy
Here are two stocks that could be ready to buy in the next couple of days. Do your own DD.

 These are lower priced (higher risk) stocks. Be sure - before you act. GL traders.
01/06 Update - SVA pre-market news was downbeat. Another example of why we wait for the signals.


01/06 Update - SVA pre-market news was downbeat. Another example of why we wait for the signals.
Subscribe to:
Posts (Atom)